Bloom “Box”: Reverse Engineering the Economics

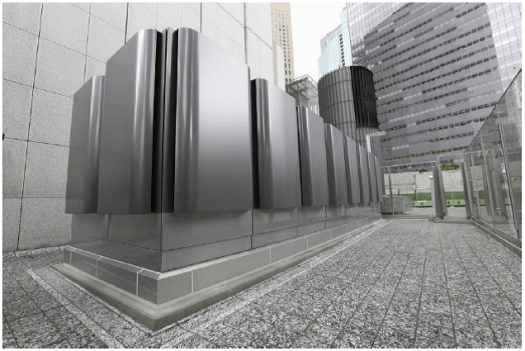
Last July Bloom Energy announced the placement of a 200 kW “Energy Server” (Bloom’s preferred language for “generator”) at Keio University in Japan, another at a large Softbank building in Fukuoka (Softbank is a major Japanese mobile phone service provider), as well as the creation of a 50/50 joint venture with Softbank to establish Bloom Energy Japan, Ltd.  These announcements were all part of the steady drumbeat of Bloom unit installations.  About the same time, however, Bloom issued a white paper where the President of Bloom Energy Japan, Miwa Shigerumotu, provided some insight into their pricing structure.  Below is a picture of the Bloom installation at the Softbank building.

softbank

Source: Bloom Energy Japan, Ltd.

As with other installations, Bloom is selling the product of the product, rather than just a piece of equipment.  The customers receive full output of the units with no upfront costs, paying a fixed rate of 25 yen/kWh, or about USD 0.21/kWh.  This rate is fixed at 10 years, with no fuel adjustment clauses.  In the white paper Mr. Miwa acknowledges that 25 yen is high relative to current prices, but goes on to say that the days of predictable electricity prices are over.  From April 2010 to April 2014, electricity prices in Japan rose an average of 10% annually.  He argues that paying a premium of about 5 yen now will be more than balanced out longer term when compared with the volatile and escalating conventional electricity cost.  His bottom line: a Bloom Energy Server provides price hedging and risk mitigation.

Fair enough, but is Bloom likely making money here or just initiating a loss leader program to pave the way for future sales?  We can get a very approximate sense of the implied cost of the unit with some reverse economic calculations.

The most significant variable cost to Bloom is fuel price.  The Bloom units are running on liquefied natural gas (LNG), which is not an inexpensive commodity in Japan.  The chart below gives some perspective to Japanese LNG pricing relative to the US and UK (Blue is US Henry Hub; Green is the UK and Red is Japan).  Last winter Japan LNG was at about $19/MM Btu.

Rice Univ

Source: National Gas Price in Asia, Rice University

The figure above overlays the timing of the Fukushima disaster and the closure of the Japanese nuclear fleet, which clearly had a major impact on price (and on the price increases noted above by Mr. Miwa).  Longer term, however, most analysts do not foresee a return to UK- or US-like pricing in Japan.   The Economist forecasts a decline in Japanese LNG price over time.

IMF

Whereas the IMF foresees a relatively constant price for the next several years.

IMF 2


Forecasting LNG prices in Japan is further complicated by the fact that, at least historically, Japanese LNG prices have been strongly correlated to world oil prices.  It remains to be seen if OPEC’s production announcement keeps oil prices stable in the short term but resulting in an increase when many now uncompetitive shale projects fail to survive, reducing supply.

For the purposes of this approximation, we’ll assume a fuel cost range for our Bloom units between $10 and $19/MM Btu.  We’ll also assume that Bloom internally financed the capital cost for these units at about a 2% interest rate.

Along with some other assumptions about O&M costs and taxes, the following break even maximum costs of capital as a function of fuel cost assumptions can be calculated.

Fuel Cost, $/MMBtu $/kW installed to achieve 10 year levelized cost of electricity equal to USD 0.21/kWh*
10 $9,000
15 $6,800
19 $5,000

When the first Bloom units were sold, industry estimates for their cost was on the order of $30,000 kW to $40,000/kW.  Perhaps 100 have been sold in the interim.  Given that starting point, it seems very unlikely that 100 units could result in economies of scale that would reduce cost by a factor of 5 or 6, as would be necessary for these two examples.

Even given all of the necessary caveats about the very approximate nature of the estimates and assumptions made above, loss leading is the market introduction strategy for Bloom in Japan.


*21 cents uses the current exchange rate – at the time the transaction was completed earlier this year the rate would have been nearly 25 cents US.  Perhaps this is why there was a report last month that the current rate is 28 yen/kWh.

“Open Sourcing” of Fuel Cell Technology: A Call to Action

“Ideas are works of bricolage.  They are, inevitably, networks of other ideas.

.. the strange thing is that the past two centuries .. wisdom about innovation has pursued the exact opposite argument .. by assuming…in the long run, innovation will increase if you put restrictions on the spread of new ideas, because those restrictions will allow the creators to collect large financial rewards from their inventions. And those rewards will then attract other innovators to follow in their path.

The problem with these closed environments is that they make it more difficult to explore the adjacent possible, because they reduce the overall network of minds that can potentially engage with a problem and they reduce the unplanned collisions between ideas originating in different fields.”

Stephen Johnson, WSJ, The Genius of the Tinkerer, September 25, 2010.

Background

During my tenure as president of a PEM fuel cell development company it occurred to me that all of the other development firms might be attempting to solve, in varying degrees, the same challenges we faced in improving bipolar plates, reducing the size and increasing the efficiency of reformers, minimizing amounts of expensive catalysts necessary, boosting electrical efficiency, etc.  If my conjecture was correct, it meant that, at least within the US industry, groups of people in 10 or 20 companies were trying to accomplish the same objectives.  Of course, they all probably believed that they were close to the Holy Grail, that their IP was superior, that their work would result in enormous returns down the road.  I suspected, however, they the differences in technology among all these companies were more likely to be infinitesimally small.

That was 12 years ago.  At a recent conference I heard the same generic issues raised, still unsolved, and in a market where we have created and dashed investor expectations on more than one occasion.  So the idea reemerged.

What if we were free to share ideas and not waste time, money and resources behind artificial walls built out of a hubris that each one of us had the silver bullet, the world beating answer, the killer app?

Open Sourcing

Certainly most people have heard about “open source” software where the basics of a software platform are available to anyone to build upon.  Not many people, though, are aware of the fact that the concept of open sourcing ideas, intellectual property and know how is neither solely related to software nor a new concept.  In fact application of this concept was crucial to the evolution of the US auto industry (Ford challenged a monopolistic patent in 1911 and freely collaborated with others through the 30’s), the advanced state of US aviation at the start of WWII (Curtiss challenged Wright’s monopolistic patents, ultimately resulting in the US forcing a settlement and a sharing of technology through WWII), and the rapid advancements in this country in semiconductors beginning in the 50’s when patents and intellectual property rights were largely ignored (see Texas Instruments and Fairchild Semiconductors).  There are many more non-IT examples.

So What Are We Talking About and Why Do It?

I’m going to borrow heavily here from a paper written by HP[1] that aptly summarized why this makes sense to do and what the benefits might be.

The Concept

First, what are we talking about?  The following chart was constructed to graphically show how components of a software system might be merged.  Take a look at this and think “Fuel Cell Systems.”

ovals

Let’s start with the three grouped ovals.  Replace “Project” with “Company 1, 2, ..n” and replace “un-shared independently developed software” with “technology challenges common to all Companies that the Companies believe only they can solve.”  The white areas of the independent ovals are things genuinely unique to the Companies.  Now look at the single circular figure on the right.  The Companies each have their own unique qualities within the large circle of “Fuel Cell Systems” but the big black core is all of the shared IP.

The Benefits

It doesn’t take rocket science to quickly grasp what a difference this approach might make in moving the entire industry forward.  Let me paraphrase the HP paper’s summary of benefits in fuel cell terms:

  • A readily available potpourri of basic system component technology that can be built upon and used as starting point;
  • Improved quality levels of shared technology as authors’ reputations are at stake;
  • Shared, community debugging; and,
  • Faster development schedules with technology leveraged among several products.

Imagine how much reinvention of the same wheel across 20 companies could be avoided.

The Downside

Of course, there’s the downside.  In every one of these companies there is at least one key person who has inventor’s syndrome.  The affliction that says absolute and total restrictions on my intellectual property is the only path to the overwhelming array of riches I will gain when my twist on the technology gets out there, since no one else out there has anything close and they are not as smart as me.  Usually there is a lawyer appended to this person’s anatomy somewhere.

One Size Does Not Fit All

Will it work across all fuel cell technologies?  Theoretically, yes, but realistically we’d want to have many participants.  The best place to start is PEM, but SOFC could also be a contender.

The Risk

Given the current state of our business sector that is suffering from:

  • At least two and perhaps three cycles where several companies in the sector raised thoroughly unrealistic expectations within the financial community that were never achieved, resulting in very limited investor appetite in hydrogen energy;
  • A Department of Energy that seems to have dismissed fuel cells and hydrogen from its R&D agenda; and
  • A global community that is overtaking the US industry because within certain countries the functional equivalent of open sourcing is happening

It doesn’t seem there is much to lose by trying.

The Recommended Path

Form a subscription based not-for profit organization whose sole purpose is to provide real and virtual opportunities to share ideas and information and do so in a way that does not run afoul of anti-trust laws or generate IP litigation.  This can take the form of databases, conferences, workshops, wiki collaboration on the web, networking and probably 10 other ways that do not immediately come to mind.

Can it be done?

Yep. It has been done before and it continues to be done in other industries.  Wright and Curtiss are a great historical example.  So are Texas Instruments and Fairchild Semiconductors.  Many very large firms have come to embrace it, including Procter & Gamble.

Provided we have a critical mass of interest, sufficient funding to engage the proper counsel to avoid the pitfalls and manage the operation and its communications vehicles, and enough open minded company managements to make it work.

Interested?  

Call me. Gerry Runte (207( 361-7143 or email [email protected].  If there is sufficient interest we can begin to lay out a plan on how we want to pull this off.

[1] Dinkelacker, and Garg “Corporate Source: Applying Open Source Concepts to a Corporate Environment,” HPL-2001-135, May 31st , 2001

Fuel Cells in the (Japanese) Home!

Many in the US are unaware of the fact that residential fuel cells are being routinely sold in Japan, especially in new home construction.  They are called ENE-FARM or “energy farms” that produce about 750 W of electricity with heat recovery.  The ENE-FARM fuel cells are all Proton Exchange Membrane (PEM) technology, but solid oxide based units are en route.They are especially popular in homes with radiant floor heat.  24,000 units were sold in 2012; nearly 18,000 were sold in the first half of 2013.  At the end of 2013, about 50,000 units were in operation across the country.   Some of that more recent demand was fueled by Fukushima, but more on that later.  The national government has a goal of 1.4 million units by 2020 and 5.3 million by 2030. If the economics continue to achieve economies of scale, those goals will easily be exceeded.  Let me walk you through the promotional material used by a gas company near where I live.

Components

Shizuoka Gas’s offering happens to be a Panasonic model that came out in 2013.  It consists of two boxes: the fuel cell, which includes the reformer, fuel cell stack and inverter; and the hot water unit which includes waste heat recovery, storage and a backup heat source.  The figure below shows the boxes and their control panels.

boxes

Specifications

Fuel Cell

Electrical Output 750 kW
Exhaust heat output 1.08 kW
Electrical Efficiency (HHV/LHV) 35.2% / 39.0%
Heat Recovery Efficiency (HHV/LHV) 50.6% / 56.0%
Dimensions 1.85 m x 0.4 m x 0.4 m (6 ft x 1.3 ft x 1.3 ft)
Gas consumption (HHV / LHV) 2.1 kW/1.9 kW
Noise level 33 dB
Weight 95 kg (209 pounds)

Hot Water Storage Unit

Hot water temperature 60 o C (140 o F)
Storage Capacity 147 liters (39 gallons)
Dimensions 1.85 m x 0..56 m x 0.4 m (6 ft x 1.8 ft x 1.3 ft)
Weight 209 kg (460 pounds)

Hot Water Supply and Backup Unit

Heat source Instantaneous latent hear recovery
Hot water supply capacity 41.9 kW
Heating capacity 17.4 kW
Maximum gas consumption 64.8 kW
Dimensions 0.75 m x 0..48 m x 0.25 m (2.5 ft x 1.6 ft x 0.8 ft)
Weight 44 kg (97 pounds)
Noise 49 dB

Maintenance

Shizuoka Gas offers free maintenance for 60,000 hours or 10 years.

“Learning” Operation

This particular unit has the ability to analyze the demand pattern for hot water and electricity in the home, and then adjust its operation accordingly.  In the event that an unusual call for hot water occurs the backup water heater engages.  The picture below shows the demand for electricity at the top and the demand for hot water at the bottom.  The middle, pink section, shows the learned state of the water storage unit that anticipates need.

learning storage


Overall Efficiency

Everyone appreciates the rationale for a gas company to sell gas appliances, but it goes farther than simple demand creation.  Japan has no source of natural gas and relies on imported LNG instead. Combusting LNG for power generation yields the typical mid-thirties efficiencies.  Reforming LNG at the end user location however, gives much better results.  This is how Shizuoka Gas explains it:

Conventional Generation Efficiency

con eff

Adding the ENE-FARM to the Equation

fc eff

Economics

The suggested retail price for the system is around ¥2 million installed.  That’s about $20,000 – and about 2/3 the 2009 cost.  After subsidies, however, most consumers end up at or less than ¥1 million, or $10,000.  Annual savings are on the order of $600/year, so the simple payback is around 17 years.  Clearly this is still for environmentally conscious upscale consumers, but there are plenty of them in Japan.

Taking it all a step further..

SHIZGAS (as Shizuoka Gas likes to be called) is promoting a solar PV/fuel cell cogen system that clips the peak that the fuel cell can’t handle with an installation like this:

peak


Here is the schematic of the house:


p_06_zu_b


But they’ve gone much farther than a simple concept and built a 22 unit subdivision called Eco Life Square Mishima Kiyozumi.  It’s been completed since 2011.

4-11-2014 5-26-26 PM

231228エコタウンsk8k

Summary

Eleven years ago I was involved with a small fuel cell development company that was pursuing a residential fuel cell.  When I joined it became very clear that such a first product for the technology was a bridge too far, way too far, and we reoriented ourselves to a commercial scale unit, the first prototype of which was a naphtha fueled PEM unit that operated at a gas station to make hot water for car washes and provide backup power in the case of an emergency.  Ironically the Japanese firm that tested that unit, ENEOS, now offers an ENE-FARM system (not derived from our technology however).

Residential fuel cells for the US may still, indeed, be a bridge too far, but they are becoming well established in Japan, and in part, because of Fukushima.  Residential customers, albeit wealthy residential customers, want the ability to have more predictable electricity costs and the ability to self-generate, having experienced power shortages, outages and higher costs.  Also, unlike the US, there is a very strong ethic here to mitigate carbon.  While not carbon neutral, fuel cell efficiencies do mitigate LNG fired central generation emissions.

Japan’s Basic Energy Plan: Not All About Nukes

On February 26 the Japanese government published its latest Basic Energy Plan (BEP) for review and approval by the Cabinet.  Approval is expected, sometime this month.  The foreign headlines tended to focus almost exclusively on its statement that nuclear power remains an important source of energy.  This new BEP should have come as no surprise, given earlier commentary by the Abe government.  A more detailed read, however, reveals a far more nuanced story for nuclear as well as discussions of some interesting new developments.

Nuclear Impact

At the time of the Great Eastern Japan Earthquake and Tsunami in March 2011 Japan had 50 operational reactors ranging in age from 43 to 5 years.   They provided a little over 44 GW to the Japanese grid, or about 27% of total electricity generation.  Another 4 units were at some stage of construction, and another four units had been planned.  The then effective BEP had a goal of 50 % nuclear power generation by 2030.  All operational reactors have been shut down and construction halted on new units since the tsunami.

In September of 2012, the then current government issued a strategy statement that had as its goal the phase out of nuclear power by 2039.  This “statement” did not amend the current BEP prior to the Fukushima incident, and further, when the new government of the Liberal Democratic Party took over in late 2012, the Prime Minister, Mr. Abe, made it clear that it did not support a phase out.  The official BEPs, before and after the disaster, have never reflected a “no nukes” position.

There were changes to the text discussing nuclear, however.  Its introductory paragraph goes to great lengths to make clear the severity of Fukushima.  Roughly translated, it says:

“Nuclear energy policy must take into consideration an honest understanding and appraisal of the Fukushima Daichi nuclear plant accident.  The accident raised worldwide awareness of the risks of nuclear power.  Distrust and anxiety among the general public is stronger than ever against nuclear power and against the government and businesses who promote it. 140,000 people have had to be evacuated and there is international anxiety over water purity and pollution from the accident.  In addition to delays in information regarding the accident and delays in selecting final disposal sites and delays in the reprocessing plant feed this distrust. Interest in energy issues has become extremely high in the country and many want to eliminate nuclear power generation altogether. At a minimized scale, nuclear power is still necessary, but the government must address the public concerns.”

There is also an extensive section specific to the steps to be taken at Fukushima during its “30 to 40 year” decontamination and decommissioning.

Japan’s Problem

The following chart, which was provided at the end of this latest draft Plan, clearly illustrates Japan’s problem (click on image to enlarge).

JPN Load

The two bars to the right show the makeup of electricity supply in 2010 and 2012.  Halting nuclear power generation resulted in a near tripling of oil and a 25% increase in natural gas/LPG use.  These measures, especially oil consumption, have impacted Japan’s balance of payments, retail rates and greenhouse gas emissions.

Revised Overall Plan

Chapter 1, “Challenges to our energy supply and demand structure;” Chapter 2 “A new perspective on energy policy;” Chapter 4 “(R&D, strategic energy technology development;” and Chapter 5 “Deepen communication with all levels of civil society” were unchanged.  Chapter 3, discussing long term measures to address energy supply and demand, received considerable edits, as shown in the table below.  Section 4 of this chapter constitutes the full discussion of nuclear power.  (Text in blue remained the same; subheadings under unchanged sections are not shown for brevity.)


2/26/2014 Draft Table of Contents

Chapter 3 Long term, comprehensive and systematic measures to address energy supply and demand

  1. Promotion of a comprehensive policy for secure, stale and secure energy  resources
    1. Promotion of upstream advance and strengthen relationships with new resources supplying countries in North America, Russia, Africa, etc.
    2. Strengthening the foundations of resource procurement current environment
    3. Improvement of resource procurement conditions for energy cost reduction
    4. Promoting the development of domestic resources such as methane hydrates
    5. Strengthening promotion of recycling is essential to ensure a stable supply of mineral resources and reserves system, etc.
  2. Implement an energy-saving society through smart, flexible consumption
    1. Strengthening of energy conservation in each Ministry
    2. Use of demand response to promote the efficiency of energy supply
  3. Accelerate medium-to long-term renewable energy with the aim of self-reliance be introduced
    1. Strengthening of efforts to accelerate the introduction of wind power and geothermal
    2. Promote the use of renewable energy in the distributed energy system
    3. Role of feed-in tariffs
    4. Promotion of a variety of deployment with a focus on renewable thermal energy
    5. Promotion of renewable energy industry in Fukushima Center
  4. Rebuild nuclear energy policy
    1. Starting point of the nuclear policy–a sincere remorse Tokyo electric power Fukushima Daiichi nuclear power station
    2. Fukushima rehabilitation and reconstruction measures
    3. Establishment of a stable business environment and continuous improvement in the safety of nuclear power
    4. Efforts to steadily promote measures without delay to the future
    5. Build trust relationship public , local governments , with the international community
  5. Improve the environment for the efficient use of fossil fuel
  6. Promotion of supply structural reforms to remove market barriers
  7. Strengthening and toughening of domestic energy supply networks
    1. Strengthen response to the crisis of supply disruptions from abroad by oil reserves, etc.
    2. Strengthen response to domestic crises.
  8. Changes to the secondary energy structure to contribute to the supply and global warming
  9. Growth strategy based on the generation of integrated energy companies through market integration and energy realization
  10. Comprehensive energy international cooperation development


The following are highlights from the new sections of Chapter 3.

Section 1

  • Invest in upstream development by Japanese companies through aggressive diplomacy on the part of the National Institute of Oil, Gas and Metals (JOGM) and provide loan guarantees through public and private sector cooperation.
  • Establish floating form LNG production storage and shipping facilities
  • Strategic investigation of mining shallow water hydrothermal vents for rare minerals in Sea of Okinawa
  • Apply for mining permits outside of Japan Economic Zone through the International Seabed authority, including rare earth minerals off Marcus Island and manganese nodules near Hawaii.
  • Commercialize methane hydrate production by 2018.
  • Assess 6,000 sq. km annually through 2018 for oil reserves.

Section 3

  • Speed up the environmental assessment and on the electrical business law regulatory science to promote more geothermal and wind power generation.
  • Embrace renewable energy in areas between transmission lines.
  • Promote the development of special purpose companies aiming for return on investment relating to transmission line maintenance.
  • In the newly established regional management promotion agency, adjust the frequency variations in wide-area systems to accommodate the increased use of renewable energy that cause fluctuations in the electric power system.
  • Absorb fluctuating renewable energy along with a large storage batteries and hydrogen activities.
  • Demonstrate large storage batteries for introduction demonstration to substations, etc. and with international standardization.
  • Through R&D seek to reduce large battery costs by half by 2020.
  • The increased use of offshore wind power is indispensable.
  • Seek to achieve world’s first  commercial floating offshore wind power unit and promote empirical research to being conducted off the coast of Nagasaki, as soon as 2018.
  • In the 17 months since their introduction in November 2012, feed in tariffs have increased renewable generation by 30%.

Section 4

  • Accelerate efforts to ratify the Convention on Supplementary Compensation for Nuclear Damage (CSC).
  • Expand capability to store spent nuclear fuel; promote the use of MOX fuel and reprocessing.The text specifically calls for timely commissioning of the Rokkasho reprocessing plant and restart of the Monju sodium cooled fast reactor. Monju cost $200 million a year to maintain and has been subject to many shutdowns and safety violations since it began operation in 1994. While there may be begrudging public support for the restart of a few reactors most editorials question the need for generating more plutonium and want to see the Monju shuttered.

Conclusions

It’s really unfortunate that this and earlier drafts of the BEP have not been translated into English.  What I’ve done here is synthesize a number of translation routines and combined that with my own perspective.  Surely I’ve missed a great deal without a complete translation.  Regardless, it is clear that the summaries of this document in the world press did not do it justice and perhaps were tinged with a lot of optimism.  Relicensing of the idle reactors will not be simple and at best guess between 10 and 12 might make the grade.   In addition those that do survive the process will not be operating any time soon.  The Nuclear Regulatory Authority is reportedly bogged down in paperwork and still trying to work through a process that is not fully defined.  Recent editorials in the Asahi Shimbun and The Japan Times make it clear that public sentiment, except perhaps in and around Tokyo, is not entirely behind nuclear restart.  The BEP itself makes clear that local authorities will have a lot of influence on restart decisions.

In the meantime, the other portions of the BEP have catapulted Japan into a much more supportive climate for renewables and, it seems, especially with regard to smart grid, T&D automation and demand response.

SOX and Carbon Mitigation Legislation: Deja Vu All Over Again? Maybe Not.

Surely I am not the only one who recalls the debates of the 80s that culminated in the 1990 Amendments to the Clean Air Act (CAA90).  Title IV-A of the CAA90 created the cap and trade program to limit sulfur oxides and nitrogen oxide emissions. At the time it was controversial and multiple campaigns were organized to assure its defeat.  The CAA90 did pass, and not only did none of the apocalyptic events forecasted by its detractors happen, but it still performs successfully today.  What I find remarkable when I think about those debates is that they seem nearly identical in tone, arguments and players to the current debate about mitigating carbon emissions.  Yet today, all attempts at finding legislative solutions to mitigate carbon have failed.  I believe there are several reasons.

For those not present then, a very brief summary.  Late in the Carter Administration sulfur dioxides from coal power plants were flagged as the cause of acid rain that was affecting the ecosphere, especially in the Northeast.  Carter attempted to both fund research on limiting emissions but also encouraging utilities to switch from oil to coal to limit oil imports. When the Reagan Administration marched in, doing anything to mitigate oil use was left to the free market and acid rain was dismissed as a natural phenomenon.  In fact one of the first steps taken was to appoint a dentist as Secretary of Energy whose mission was to close the department.  Ultimately any real action was successfully delayed under Reagan but immediately taken up by the Bush Administration.  They fostered a Republican “free market” scheme to regulate sulfur and nitrogen oxide emissions by creating an open market of emissions allowances, now known fondly as “cap and trade.”  The concept was simple: let utilities decide the better economic choice – pay a known price to pollute or pay the cost of emission control equipment. CAA90  was signed into law with overwhelming bipartisan support; the sulfur and nitrogen oxide emissions trading markets continue to function, and function well. Ironically it was modelled on a cap and trade program that the Reagan Administration implemented to phase out leaded gasoline.

After 20 years these are the results:

Emissions reductions

emissions

Source: EPA

Cumulative cost of compliance: $27 billion; Cumulative benefits: $500 billion

About $150 billion come from putting a monetary value on the following chart:

The 1990 Clean Air Act Amendments prevent
 

Year 2010
(in cases)

Year 2020
(in cases)

Adult Mortality – particles

160,000

230,000

Infant Mortality – particles

230

280

Mortality – ozone

4300

7100

Chronic Bronchitis

54,000

75,000

Heart Disease – Acute Myocardial Infarction

130,000

200,000

Asthma Exacerbation

1,700,000

2,400,000

Emergency Room Visits

86,000

120,000

School Loss Days

3,200,000

5,400,000

Lost Work Days

13,000,000

17,000,000

Source: EPA

So let’s look at the similarities between then and now.

Science or lack thereof

Then

  • In 1980 the National Coal Association argued that sulfur emissions would decline over time even though new coal generating stations would be coming on line, so there was no need for regulation.  This report was not given a lot of credibility.
  • 6/13/1982 The New York Times “Meanwhile, the National Academy of Sciences has been frozen out of Government-supported research on acid rain, with the Administration suggesting that academy studies are biased and the academy’s friends hinting the Administration might be unhappy with the scientific truth about a politically volatile subject.”
  • 11/23/1981 Ad in The Wall Street Journal by the Coalition for Environmental Energy Balance: “there is a great deal unknown about this subject. The fact that there is a great deal unknown has not deterred a Senate Committee in Washington from reaching a point where it may approve legislation supposedly designed to control acid rain.”
  • 10/17/1985 The New York Times “A group of scientists doing research on acid rain issued a report today saying that a substantial scientific consensus existed on the need to act now to curb the problem.”

Now

There are myriad websites and blogs churning out huge volumes of stories about how anthropomorphic climate change is a hoax and unscientific.  Their argument are a hodgepodge of innuendo and logical fallacies sometimes amazingly contorted to support their position.  Correspondingly, many reports and peer reviewed studies not only confirm what is happening to the planet but are revealing the fact that change is becoming quicker and less predictable.

Big Tobacco Connection

Then

This certainly seems like an odd one, but all during the 80’s several people and organizations collaborated to generate studies that asserted there was no evidence linking:

  • Smoking to lung cancer
  • Acid rain to coal power plants
  • Second hand smoke to poor health
  • Asbestos and lung disease

Most of these reports were funded by the Tobacco Institute, via their think tank at the time, the Alexis de Tocqueville Institution.  Alan Katzenstein also generated lobbying reports for both the tobacco industry and against the idea that there was a link between coal emissions and acid rain.

Now

Two key members of the Institution, Paul Seitz and Fred Singer, both physicists, began to ally themselves with the Heartland Institute, founded by one of the founders of the Alexis de Tocqueville Institution.  Heartland embraced the tobacco campaigns but then began to lean heavily into climate change issues and Seitz and Singer led studies on why man is not affecting the climate with greenhouse gas emissions.

Heartland and a host of other “organizations” of a similar ilk have found new donors in Koch Enterprises either directly or through its surrogates, the Americans for Prosperity and the American Legislative Exchange Council.

Economic Impact

Then

  • 1983 Edison Electric Institute (EEI) releases study claiming that acid rain legislation would require its member companies to significantly raise rates. Two utilities would have to increase rates by 50% or more; eight expected an increase of 20% or more.
  • 1986 “Citizens for Sensible Control of Acid Rain” claim acid rain legislation will cost $110 billion and would mean up to 30% higher electric bills and destroy the economy. “Citizens…” actually Consolidated and Peabody Coal, two American Electric Power operating companies, the General Public Utilities companies and American Cyanamid.
  • The Coalition for Acid Rain Equity published the following ad claiming the loss of tens of thousands of jobs.

acid rain add


  • 1/23/1990 The Washington Post ad by Cyprus Minerals: Cutting Off Coal to ”Cure” Acid Rain Could Short Circuit America’s Electrical System.”

Now

  • Heritage Foundation December 2013 EPA carbon regulations kills ~600,000 jobs annually, raise electricity rates 20%
  • National Economic Research Associates on behalf of the American Coalition for Clean Coal Electricity: increase in utility costs of $184 billion, or $18 billion per year.  Retail ele3cticity to increase by between 12% and 24%.
  • ALEC 50% increase in cost of gasoline and residential electricity; 75% increase in cost of industrial electricity and residential natural gas; and 600 percent increase in utility coal prices. $20 billion in added annual costs.

Lobbying

Then

A number of lobbying groups emerged, some accused of pretending to be grassroots organizations but in reality representing various collections of utilities and coal companies.  Some of the biggest:

  • Citizens for Sensible Control of Acid Rain
  • Alliance for Balanced Environmental Solutions, formed by EEI
  • Coalition for Acid Rain Equity

In June 1987 the New York Times reported that the “Industry opponents of legislation to control acid rain were the champion spenders among Capitol Hill lobbyists in 1986.” The article noted that of the $60 million spent, the largest single spender was the Citizens for Sensible Control of Acid Rain.

Now

In 2012 dollars, the amount spent in 1986 amounts to about $124 million. Utilities and oil and gas industry spent $510 million between January 2009 and June 2010 on lobbying to defeat the energy bills under consideration at the time in both the House and Senate.

One single entity, Koch Enterprises, funneled $25 million through 35 lobbying organizations; $6 million through its PAC; and $38 million in direct lobbying in 2010.

So What’s Different?

In the lead up to passage of the CAA90 we witnessed multiple campaigns to defeat this legislation.  Today we have campaigns mounted against any new legislation that involves carbon mitigation. For the most part the same antagonists are at work today making very similar arguments to those made 20 years ago.  But CAA90 did pass, SOX and NOX cap and trade was implemented and as we well know, no economies were harmed nor did retail electricity rates skyrocket.  Today, though, all attempts at finding legislative solutions to mitigate carbon have failed and are likely to fail in the near future.  I think we can look to four factors: money; the internet; polarized politics; and the right wing entertainment industry.

As noted above, considerably more money is pouring into anti carbon groups and campaigns beyond anything imaginable in the 80’s.  In addition to legislation, enormous amounts of money are targeting the EPA’s rulemaking on carbon caps.  The shear volume of money available to counter legislation is exacerbated by the Citizen’s United case allowing for much more corporate funding of politics with far less transparency.  There are no reliable summations of how much is being spent where and by whom. In the case of the period 2009 to 2010, opposing groups spent about 7 times that of groups in support of the legislation.

The internet did not exist in the 80’s, so the dialogue about SOX and NOX really had limited reach to the general public.  Those at odds were still the establishment and the battle lines were drawn based more on self-interest than any partisan position. Currently there are hundreds of blogs churning out enormous amounts of misinformation to folks only superficially aware of the issues and challenges.  The primary activist groups can get information out in fire hose quantities that can overwhelm legislators.

CAA90 voting fell on lines of self interest.  Legislators from both sides of the aisle in areas where coal was king were allied.  Both parties supported environmental stewardship.  It passed with significant majorities in both houses.  Today we are well aware of the partisanship and polarization that exists.  Carbon mitigation to some is just another liberal folly.  Others, paranoid about global government and socialism, have been gullible to the argument that carbon controls are part of a grand conspiracy among scientists who are complicit in enslaving the world and who want to preserve their research funding. The right wing has adopted as dogma that man made climate change is a hoax foisted on Americans and the only patriotic thing to do is oppose it, not realizing where the anti-carbon arguments are coming from.

Finally there is the right wing entertainment industry that generates propaganda through outlets that allege to be news organizations and political commentators.  These players have large audiences who believe them to be the sole source of truth and those audiences vote for candidates who sound like their favorite TV or radio program.  Roger Ailes was just a political consultant in the 80’s and did not get to Fox News until 1996. Limbaugh did not become popular until just prior to when CAA90 became law.  They can marshal a very vocal minority to the extent that Republican lawmakers will not risk running afoul of them.  That collection of entertainers inflames the polarization already present and stokes the “global warming is a hoax” flames.

However daunting it might seem trying to combat these four factors, a few things are happening that hold promise.  The civil war within the Republican party is fracturing alliances and may prove to break the tea party hold on its policies.  Republicans are now being opposed by other Republicans with the same opaque money machines fueling ALEC and AFP.  A small group of Republicans, led by former Representative  Bob Inglis,  understands that the party is on the wrong side of this issue and is trying to turn it around.  And a handful of tea partiers who have compared energy policy with their ideological values are now supporting solar and distributed generation.

The next several years will be interesting.

Time To Play The Green Tea Card?

Ever wonder about the fact that the ideology of the two US political parties happens to be directly contrary to the implied ideology of their energy policies?  We have a party on the right that espouses limited government, personal responsibility, local control and minimal regulation. The party on the left promotes the advantages of government, the value of regulation and places limitations on local decisions that are contrary to national policies. If there were a consistent ideology, the left would be the friend of all forms of central generation, looking out for the greater good through a national, centrally controlled and regulated transmission grid.  Conversely, the right would be demanding distributed generation, local control of energy of all forms, and an end to large scale generation as well as transmission lines for which the providers of rights of way gain no direct benefit.

That might be changing.  A little.

An odd coalition has formed in Georgia between members of the Tea Party and the Sierra Club called the Green Tea Coalition (https://www.facebook.com/thegreenteacoalition).  The Green Tea Coalition (GTC) was organized in Georgia initially to fight, oddly enough, the Americans for Prosperity (AFP), the front organization for the Koch brothers, over a proposal before the Georgia Public Service Commission to require Georgia power to increase its solar capacity by 525 MW by the end of 2016.  Ultimately the Commission voted to mandate the capacity increase.

Since that vote in August the GTC have taken on the cause of cost controls for the Vogtle nuclear plant, in one of the few states where Construction Work in Progress (CWIP) is allowed in rates.  They also published a Utility Customer Bill of Rights that would exclude CWIP and utility lobbying expenses from rate recovery.  Just this month Georgia Power withdrawing a proposed tariff on residential solar, attacked as the “solar tax” by GTC.

In Arizona a similar organization has taken root (Tell Utilities Solar Won’t be Killed – TUSK), led by the son of Barry Goldwater Jr., to fight Arizona Public Service’s attempts to roll back solar subsidies and charge a $100/month fee for net metering. And like the GTC, finds itself head to head with two other Koch s front organizations: the American Legislative Exchange Council and the “60 Plus Association.”

Both organizations have prompted “main stream” conservative figures and news outlets to refer to them as defectors.  The AFP, “on behalf of the Georgia Tea Party Inc.,” without any apparent irony, claimed the GTC “breaks with tea party values.”

The Tea Party has been responsible for considerable political disruption of late, driven by ideology and misguided zeal.  The argument that distributed generation under local control surely has an ideological appeal to them.   Might rechanneling this energy to support greener, or at least olive drab technology options make sense in other regions?

Where are the smart nuclear advocates?

Enthusiasm for nuclear power among its advocates has found new energy lately and has generated reams of what they view as important arguments in newspapers, TV ads and industry forums. Instead of focusing on nuclear’s primary barrier to widespread use – economics – all manner of peripheral arguments are being made.  Their arguments can be categorized as: 1) the public’s perception of nuclear risk is misplaced and would improve with proper education; 2) nuclear is in competition with renewables and they are therefore the enemy; and 3) nuclear is the low carbon option for the future. The first argument is actually irrelevant; the second is rather silly.  The carbon argument could be useful to mitigate economics if there was a way to value it, but I doubt many large utilities and large industrials are avidly lobbying for carbon cap and trade or carbon taxes.  Without something like those measures, carbon reduction is simply a nice sentiment.

Public Perception

So what about the public?  The fact of the matter is that, at least in the U.S., public perception or nuclear hazards has not halted the construction of any nuclear power plants, nor is it likely to do so in the future.  What’s interesting is that this has been the case for the last 30 or 40 years, in spite of Three Mile Island (1979), Chernobyl (1982) and Fukushima (2011).

Check out the results of polls between 1977 and 2006.  The next figure shows the results of three separate surveys repeated on roughly a two year cycle between 1976 and 2006.  Public acceptance was over 50% until the TMI accident.  It remained below 50% until 1991 and has been above 50% through 2006.


Public Approval of Nuclear Power, 1977-2006

gallup

Source: NC State University

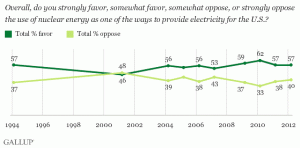
The figure below shows that a Gallup poll begun in 1994 and conducted annually from 2004 through 2012 shows that, with the exception of 2001; public acceptance has been above 50%.


Gallup Poll on Nuclear Power Favorability in U.S., 1994 – 2012

gallup2

Source: Gallup Group

I have a suspicion that many advocates simply assume that its public fears that halt new plants, without knowing the facts.

Renewables

Anyone who starts down the path of arguing for nuclear by arguing against renewables simply advertises their lack of knowledge as to how electricity is generated, transmitted and delivered.  Simply put, nuclear is base loaded power – power that is generating virtually 24/7.  It competes in a wholesale market that contains the cheapest sources of power available.  As demand rises, new generation is called, or dispatched, based on cost.  Until there exists economic grid scale storage for renewables they do not compete with base loaded power.

They do compete with renewables for subsidies, and lately renewables are getting a little more than the value of nuclear’s PTC, liability insurance, R&D and loan guarantees.  If one adds up all the subsidies nuclear has received for the last 50 years, it will take a very long time for the aggregate of renewable subsidies to surpass nuclear’s, however.

Carbon

Nuclear power plants emit virtually no conventional emissions and are viewed by some either as “zero-emissions” or as “carbon free.”   The table below shows the annual emissions of primary pollutants for three large power plants in Pennsylvania in 2009, as compiled by the U.S. Environmental Protection Agency (EPA).

Emissions Profile, Large Electricity Generating Stations 2009


Nitrogen Oxides

Sulfur Oxides

Carbon Dioxide

  Fuel

GWh

Tons

Tons/kWh

Tons

Tons/kWh

Tons

Tons/kWh

Homer City Unit 3 Coal

                    4,118

         4,507

          1.09

         55,431

              13.46

         4,165,058

         1,011.43

Fayette Energy Facility Natural Gas

                       983

               72

          0.07

                   6

                0.01

         1,176,466

         1,196.81

Limerick 1 Nuclear

                 10,019

0.0

0.0

0.0

                     0.0

0.0

                      0.0

Source: EPA

Nuclear has therefore begun to figure more prominently in national generation portfolios as part of carbon mitigation strategies.

This is, however, an area of controversy.  Like the electric car, emissions are not limited to what the device produces but what emissions occurred to construct and fuel it.  While the power plant does not emit carbon or other harmful compounds, the processes used to manufacture the fuel, plant construction, nuclear waste management and decommissioning all have their own carbon footprint.  And as with most technologies that are politically charged, there are studies that will support almost any position.

The IAEA conducted a study to assess the full range of emissions over the life cycle of the power plant.  The results of their most recent work are shown in the following table.

IAEA Life Cycle Carbon Emissions, Nuclear Generation


Grams CO2/kWh

Generation Source

Minimum

Mean

Maximum

Lignite

800

1,100

1,700

Coal

770

1,000

1,300

Oil

500

800

1,200

Natural Gas

400

500

800

Coal with Carbon Sequestration

10

100

300

Biomass

35

65

100

Solar PV

40

50

80

Wind

10

10

30

Hydro

0

5

35

Nuclear

3

7

25

Source: IAEA

A researcher at the University of Singapore surveyed 103 different life cycle greenhouse gas emissions studies involving nuclear power. Of that population he qualified a subset as havi8ng sufficient detail and appropriate methodology.  The result is summarized I this table.

Summary Statistics of Qualified Nuclear Life Cycle Emission Studies


Grams CO2/kWh

Life  Cycle Segment

Minimum

Mean

Maximum

Front-end

0.58

25.09

118

Construction

.027

8.20

35

Operation

0.1

11.58

40

Back-end

0.4

9.2

40.75

Decommissioning

0.01

12.01

54.5

Total

1.36

66.08

288.25

 Source:  National University of Singapore

The results of this survey give a more realistic appraisal of nuclear carbon emissions; nonetheless nuclear remains low in the list of alternatives. And as with all politicized discussions, you can find a study that supports nearly every position.

Smarter Advocacy

So why not be a smart advocate for nuclear?  Here’s how:

  1. End the endless churning of articles and op-eds along the lines of “If only the public understood how low the risks are,” or “Renewables will never be a significant source of energy/will never provide all our energy needs.”
  2. Deal with the real elephant in the room – cost.  It’s clear that the all in costs of new nuclear plants are more expensive than their alternatives in free market economies.  What is the value added that makes it worthwhile to pay a premium for nuclear?  That is the key to greater market penetration.
  3. Find value propositions that rationalize the premium.  One value added could be carbon mitigation.  Unfortunately it has no quantified value in the US at the moment, but could offset part of the nuclear premium if it were valued.  Nuclear advocates should get squarely behind any legislative initiative for a cap and trade market for carbon or carbon taxes that can be quantified and avoided.


Probabilistic Assessment of Global Nuclear Power Plant Construction Through 2030

The following is the Executive Summary of a recent report.  The full content can be freely downloaded at: Global Nuclear Industry

1      Executive Summary

1.1      Research Objectives

The nuclear power industry has begun to receive serious attention once again with the promise of new reactor designs and has increasingly been named among the portfolios of national governments as long-term sources of electricity.  Unfortunately, this industry has a long history of over optimism in terms of both the readiness of technology and its economics. Those parties interested in determining the kinds of growth opportunities in nuclear power business sector might offer them need a realistic appraisal of what is likely to emerge in the next eight years.

This report answers several questions regarding commercial nuclear power: Is the perceived resurgence of this industry plausible and if so, how much of a market does it constitute?  Are nuclear capacity addition forecasts accurate?  Are cost estimates for plant construction and operation reasonable?  How does the cost of electricity from these new designs compare with alternative sources of electricity?

This report also attempts to provide some context to the business of nuclear power, insight as to why it declined in the 80s and then remained dormant over much of the 90’s; what issues have been resolved since then and what barriers remain.

The objectives of the report are to equip the reader with realistic and objective insight into:

  • The nature of the nuclear power “renaissance” and whether or not it is a short term or sustainable change in the industry; and
  • Cost assessments and comparisons of nuclear technologies among themselves and other electricity generation sources

By providing

  • A synthesis forecast of all available official information regarding new nuclear plant capacity plans and capital investment; and a
  • Probabilistic forecast of new nuclear plant capacity and investments through 2030.

1.2      Scope

This report examines the global nuclear power industry and its prospects between 2014 and 2030.  The report scope includes:

  • Brief history of nuclear power commercial development;
  • Basics of nuclear generation; descriptions of the primary technologies deployed as well as the new generations of reactor designs currently in development;
  • Impact of the Fukushima-Daichi incident on the commercial industry;
  • Market drivers and barriers;
  • Assessment of the economics of the new generation technologies and how they compare with other generation sources; and
  • Forecasts of capacity additions as well as capital investments in nuclear power from 2014-2030.

In addition to providing a business context to commercial nuclear power, this report provides:

  • Insight into the relative economics of comparable sources of electricity generation;
  • A discussion of the economics of the large scale NPPs now in construction and the small modular reactor (SMR) designs that are in development; and
  • A more meaningful way to look at the growth projections of this industry.

1.3      Methodology

Worthington Sawtelle reviewed the most recent primary forecasts for nuclear power plant construction (capacity, scheduled commercial operation, construction status, cost) produced by the World Nuclear Association, the International Atomic Energy Agency, the U.S. Energy Information Administration, the Nuclear Energy Institute and the International Energy Agency.  These forecasts were further refined and supplemented by:

  • Reports and presentations by the staff of all relevant government agencies and state owned entities, including those of the U.S. Nuclear Regulatory Commission, the Russian State Nuclear Organizations, the China National Nuclear Corporation and the Indian Department of Atomic Energy;
  • Direct testimony in rate regulatory proceedings regarding the timing and costs of nuclear plants currently under construction in several U.S. states, and;
  • Private sector company financials and plans from investor and conference presentations.

In addition, we consulted secondary sources for the report, including industry journals and publications, product literature, white papers and technical journals, and financial reports for industry suppliers.

All Key Participants cited in the report were given the opportunity to be interviewed or provide input and most complied.

The base year for analysis and projection is 2014. With 2014 as a baseline, we developed market projections for 2014 to 2020 and then to 2030. These projections begin with a database that synthesizes the above sources.  We then combined its unique understanding of the key market drivers, and their impact from a historical and analytical perspective, with scenario and probability based forecasting techniques to capture the uncertainties in the forecast. Each of the market forecast sections in this report give detailed descriptions of the analytical methodologies used. All dollar projections presented in this report are in 2013 constant dollars unless otherwise cited.

1.4      Observations

Commercial nuclear power generation has had an unsettled role among the world’s choices for electricity generation. There have been periods when it was hailed as the single best option for long term, large-scale economical electricity generation.  There have also been periods where, at least in certain countries, nuclear power generation was regarded as anathema.   Indeed, during the 80’s and 90’s, very few nuclear power plants (NPPs) were constructed.  Beginning in the early 2000’s nuclear power seemed to be making a comeback with the promise of safe, environmentally sound and economic power generation delivered by a new generation of reactor designs.  A few environmental groups even accepted it as having a place among low carbon energy source portfolios.

In this decade, most countries are planning for a future where sources of electricity are environmentally benign, but sufficiently robust and economic to fuel strong economic growth. Developing nations view energy and electricity as a potential constraint on their economic growth; their available energy needs to stay ahead of their economy’s leaps and bounds.  Nuclear power is a strong consideration in these countries but less so in developed nations where capital is limited and energy demand is flat.  In 2011 it accounted for about 12.3% of electricity supply worldwide; in 2012 about 13.5%.

Much of the enthusiasm for nuclear comes from the promises of several new reactor designs including advanced pressurized water and boiling water reactors (PWR and BWR), as well as gas cooled reactors and fast neutron reactors (GCR and FNR).  These new designs have passive safety measures that allow for safe shutdown without operator intervention.  In addition, another group of small modular reactors (SMR) are in development that are scalable to meet specific energy demands of several hundred megawatts (MW).

Many of the same issues that plagued nuclear power in the past remain unresolved: cost; waste management; decommissioning expense and perceived risk.  The Fukushima-Daichi incident in Japan in 2011 heightened awareness to these issues and caused reductions in many nuclear power construction plans.

Assessing business opportunities in nuclear power is no simple task because of its hybrid nature.  Governments developed the technology as an adjunct to nuclear weapons and nuclear submarine programs.  Construction and operation of NPPs remains a government role in most countries. In fact, it is fair to say that nuclear power fits best in the context of large centrally planned economies where substantial financial resources are available and where the government bears the economic and technological risk.  Nuclear power is nonetheless a commercial venture in some free market economies with varying degrees of autonomy from government control with a very large network of fully commercial suppliers for components.  Governments and the supplier sector, both of whom need to market the viability of the technology and influence public opinion for continued support, heavily influence most forecasts of nuclear power growth.  Some governments chose to be rather opaque regarding details, especially regarding costs and the extent to which reported costs are subsidized.  These circumstances have resulted in consistently overstated forecasts and overly optimistic anticipated costs, traditions that continue today.

We believe a reasonable approach to assessing this industry incorporates a probabilistic forecast of new capacity and investment.

Figure 1 and Figure 2 present our forecast of cumulative new global nuclear capacity and the corresponding investment required.  The figures indicate that the likely range of either metric are significantly less than that of the World Nuclear Association (WNA), but within the (rather broad) range of the International Energy Agency (IEA) forecast.

Figure 1 Probable Range of Cumulative Capacity Additions 2014 – 2020, MW

Fig 1 - Copy

Source: Worthington Sawtelle LLC

Figure 2 Probable Range of Cumulative Capacity Additions 2014 – 2030, MW

Fig 2 - Copy

Source: Worthington Sawtelle LLC

Figure 3 and Figure 4  present these capacity addition forecasts in terms of the necessary investment required (on an overnight cost of capital basis. $2013).  Note the disparity between the probable range of investment and the amount that would be required if all announced plans were realized.


Figure 3 Probable Range of Overnight Capital Expenditures 2014 – 2020, $ Billions

Fig 3 - Copy

Source: Worthington Sawtelle LLC

Figure 4 Probable Range of Overnight Capital Expenditures, 2014 – 2030, $ Billions

Fig 4


Source: Worthington Sawtelle LLC

Worthington Sawtelle LLC believes these probabalistic forecast are likely to be far more accurate than the announced plans of the various industries.

1.5      Findings

Worthington Sawtelle LLC has assessed all of these factors and concludes:

  • International agencies have adopted a “high/low” forecasting basis that is so broad as to be meaningless; nuclear industry associations project capital additions about double what this probabilistic based forecast suggests.
  • Likewise, the “as announced” forecasts likely overstate cumulative nuclear investments between 2014 and 2030 by about $300 billion but understate costs on a per unit basis
  • A “nuclear renaissance” of sorts is happening, although not in the West, but in China, Russia, Korea and India.
  • The cost of electricity from new generation large NPPs is likely to be less expensive than smaller scale SMRs;
  • The state of development in SMRs is such that they do not factor in a forecast of new capacity through 2020; and,
  • Growth in decommissioning services will build with capital expenditures for decommissioning potentially rivaling or even surpassing new builds.

Nuclear Renaissance? Probably not…

“Renaissance” is a term frequently used to describe the growth in nuclear power plant construction worldwide.  I recently completed an examination of the nuclear power market and determined that this word (meaning “reborn” in French) has been misapplied. 

No nuclear power plants began construction in the US between 1979 and 2011 – now there are four: 1 in 2011 and three in 2012.  What’s unclear is whether there will be any more.  Fifteen additional plants have been announced, but none have firm construction starts and a few of them have been “indefinitely deferred” or cancelled.  During the 90’s and 2000’s a few plants in Europe began operation, mostly in France.  There are only two currently under construction in France and Finland and both are considerably delayed and over budget. So I would not call what’s happening in Western Europe and the US a “renaissance” by any stretch.  In Russia and Asia, however, it’s not a period of resurging nuclear interest.    Nuclear power plant construction certainly slowed for a while, but by no means did it stop completely.  In fact, a huge growth spurt is happening in South Korea, China, and Russia.  In fact, from 2008 through 2012 China began construction of 30 GW of new plants.  Japan had a number of plants in construction as well, but all have been suspended since Fukushima. 

At present there are 372 GW of nuclear power plants.  They contributed about 12% of the world’s electricity production.  Official forecasts predict an additional 117 GW to be installed by 2020, or an increase of about 23% at a cost of about $344 billion.  Globally, the most likely new nuclear capacity installed by 2020 will be between two thirds and three fourths of the official forecasts and the invested capital about 75% to 85% of official.  In fact, on a probabilistic basis, the official forecasts are higher than the highest metric on the distribution curves. 

Declarations of a renaissance typically originate from organizations whose primary purpose is to promote the technology or are based upon data provided by those organizations.  The source forecasts from the World Nuclear Association (WNA), (NEI) Nuclear Energy Institute, and the International Atomic Energy Agency (IAEA) are the most frequently cited reports.  The US Energy Information Administration (EIA) and the International Energy Agency also produce outlooks however these seem to rely on data similar to others. 

Additionally, many countries publish their own national outlooks and in many cases, these forecasts reflect official energy policies – policies that can be as much about intent as national pride.  These forecasts are part and parcel to the IAEA and WNA forecasts.

Given the sources of these outlooks and forecasts (with the possible exception of the EIA), they represent what appeared to me as extreme optimism and worthy of considerably deeper analysis.  In addition, some of the drivers that impact such a forecasts are rather uncertain themselves, especially global and national economic conditions.  I therefore chose to use three different forecasting methodologies: a compendium of all the official forecasts to establish the “as announced” case using the announced operation dates and capital costs where available; a scenario forecast that incorporated some assumptions about economic futures where the as announced case reflected the highest growth; and a probabilistic analysis that sought to capture the uncertainties in the scenario analysis and provide a likely range of installed capacity and capital investment.

Other findings

In addition to the conclusion that considerably less construction of plants than announced plans is likely, and at a higher unit cost, the analysis showed that:

  • Utilities installing nuclear power plants in the US and Europe are paying a premium for this technology over other electricity generation sources. Assuming the capital costs experienced by the units currently in construction in the US and Europe, the levelized all in cost for nuclear is just about 16 cents per kilowatt-hour. That’s more than any other alternative base loaded generation.  In fact a recent Congressional Budget Office report cited a range of costs for a new coal plant with carbon capture and storage between 9 and 15 cents/kWh.  GTM cites a number of solar power purchase agreements at between 7 and 9 cents.  Since these metrics are quite public, the question is not whether nuclear power is economic, but rather how much of a premium over alternatives are utilities paying to make use of the technology.
  • Outside the US nuclear appears to be marginally economic however official capital cost estimates from those countries are not transparent – the extent of subsidization not included in those estimates cannot be determined.  China just announced that all nuclear power generation should meet a cost target of about 7 cents/kWh – this is not a number that is likely to be achieved in Western countries.
  • Small nuclear plants may be coming, but none will be commercial before 2020 and they are likely to be as expensive as their big brothers. A number of countries and private firms are working on several different concepts for small modular nuclear plants.  These designs integrate all major components in a single encapsulated system that will shut itself down without human intervention under certain circumstances.  They are small relative to the gigawatt plus sized units in construction, but are all in at least the tens if not hundreds of megawatt size.   The hope is that the smaller units might be less capital intensive and easier to construct and license but it is not clear at al they will be any less expensive (on a per unit basis) than their large cousins.  I generated probability distributions for the installed capital costs for some of the front runners and compared them with the big units- any differences were too small to be meaningful.  Over the next two or three years a few demonstration units will begin operation, but this new class of reactors will not be commercial at any time through the period of the report – 2020.
  • Decommissioning expenditure forecasts for nuclear, however substantial now, probably understate what will actually happen.  Plans are being put in place to decommission all the plants in Europe, some at the end of their license lives and some much earlier than that.  Some reactors in the US may receive license extension, but others will proceed to decommissioning.  In Japan the new licensing process is just about complete and it is not certain which of the currently shut down reactors can comply with the new regulations.  Recently a number of plants have begun decommissioning and the actual costs are considerably higher than previously considered.  The range of costs are between $1,000 and $4,000 per kWe, much higher than the originally installed costs of these units.  Long term expenditures for decommissioning are likely to exceed investments in new nuclear installations.
  • Several major issues associated with nuclear power from its inception remain unsolved and unresolved over the last 20 years.

Probabilistic risk analysis proved to be a far better means to assess a market with the inherent uncertainties of this one.

Fuel Cells and 7-Eleven

About 8 years or so ago, some friends and I were trying to get traction with a fuel cell implementation scheme.  We knew of suppliers who had 1 to 5 kW fuel cell power supplies and we knew at least one supplier of a proven hydride canister storage system.  The concept was pretty straightforward: find customers in a town or city that were interested in standby power and serve their hydrogen needs with a central hydride canister fueling station where they could just swap out empties for full cylinders, ala Blue Rhino and other propane suppliers in the US.  We wanted to demonstrate that there were ways to eliminate several perceived market barriers: safety of high pressure hydrogen; high cost hydrogen; infrastructure; and customer acceptance.  For a variety of reasons we were not successful.  A firm here in Taiwan has fully realized this notion recently, although in their case the fuel cells power motor scooters.

Image

The fleet at dedication ceremony

Asia Pacific Fuel Cell Technologies (APFCT) has been running a demonstration program in the city of Kenting, a popular beach resort at the southern end of Taiwan, since last November.  The 80 scooters each use 2 metal hydride canisters- enough to give each of them about 80 km of range (with all of the caveats about maintaining 30 kph and no hills).  Twenty are in use by the county government, with the remainder free for use by anyone who stays at 17 B&B’s. So far the fleet has logged over 200,000 km.  Empty canisters can be swapped at police stations, scooter repair shops, the B&B’s and 7-Elevens.  Taiwan is an ideal market, with the highest concentration of gas powered scooters – over 50 million – and the highest concentration of convenience stores in the world.

Image

A canister exchange station

What’s interesting here is that APFCT has done this entirely from the ground up with their own portfolio of technologies: the fuel cell; its control system; the hydride canister system; and even the scooter.  They even obtained a road worthiness certificate for the scooters from the government and, along the way, promulgated a national fuel cell scooter standard. 

Image

The two canister solution

Once the Kenting demonstration is concluded APFCT is eyeing the potential market on the mainland, where over 50 million electric scooters were produced last year.  They intend to secure relationships with appropriate manufacturers to mass produce the scooters as well as fueling distribution relationships.  They are also looking at small personal vehicles as another potential product line. 

Image


The ‘micro-car” uses the same power system as the scooter