The worldwide population of motor scooters is approaching 130 million. China alone produced over 40 million gasoline powered motor scooters in 2011. Many of these engines emit 8 to 30 times the hydrocarbons and particulates emitted by automobiles. Several companies are developing fuel cell powered scooters to reduce these enormous emissions. Fuel cells are devices that make electricity from hydrogen and oxygen, emitting water vapor as the exhaust. When hydrogen is produced from renewable sources, or even from natural gas the emissions are far less than those resulting from oil refining and combustion. Fuel cell powered scooters run on that electricity.
全球目前使用小型摩托车人口已达1.3亿。在2011年仅中国就生产了超过四千万的燃油驱动摩托车,这些摩托车引擎比汽车所排放的碳氢化合物及微粒多出了8至30倍。现有数家公司研发燃料电池摩托车,以减少巨大的碳排放量。燃料电池利用氢和氧发电,唯一的副产品是水。当我们使用可再生能源,或甚至是天然气来制造氢气,都能使废气量远比炼油和火力发电来的更少。燃料电池也能作为摩托车运行的动力。
Two years ago I wrote about a very forward thinking fuel cell technology company in Taiwan (https://worthingtonsawtelle.com/fuel-cells-and-7-eleven/), Asia Pacific Fuel Cell Technologies, Ltd. (APFCT). The company had just rolled out its first major demonstration of fuel cell powered scooters.
两年前我在台湾为一家非常具有前瞻性的燃料电池公司 – 亚太燃料电池科技公司写了一篇文章( https://worthingtonsawtelle.com/fuel-cells-and-7-eleven/)。该公司当时刚举行其首次大型燃料电池摩拖车的示范运行。
What was unique about the company and its scooters was the approach APFCT took to fueling. APFCT designed their system with simplicity and consumer convenience in mind. Instead of taking the path of nearly all fuel cell transportation devices that require the refilling of an onboard cylinder with highly compressed hydrogen, the APFCT units use small canisters that store hydrogen in metal hydride powder. Instead of driving the vehicle to a fueling station and waiting for a cylinder to be filled the user simply takes their empty canisters to a vendor who exchanges them for filled canisters (with about the same internal pressure as a racing bike tire).
亚太燃料电池公司的独特之处是在充氢方式。其设计概念是系统简单性和对消费者便利性,所以设计团队并未采用现在大多数燃料电池车所使用的高压氢气瓶,而是运用低压的小型储氢罐,内装金属氢化物粉末,氢气罐的内部压力约同于竞速自行车的胎压。驾驶不需至加氢站,而只需把空罐子给供货商并同时换取新的氢气罐。
In its first demonstration APFCT put 80 scooters on the road at a beach resort in southern Taiwan. Tourists were permitted to use the scooters for free. When they ran out of hydrogen all they needed to do was to take the empty canisters to any 7–Eleven convenience store, repair shop or police station for exchange. Why 7-Eleven? Taiwan has the fifth largest number of 7-Eleven stores in the world, behind the U.S., Japan, Thailand and South Korea. There is a 7-Eleven within walking distance of almost any place in Taiwan.
亚太首次大型燃料电池摩托车示范运行是在台湾南部的海滨度假胜地垦丁。游客可免费自行骑乘亚太所提供的80辆燃料电池摩托车。当游客发现氢气耗尽时,他们只需将空罐子带到任何一间7-Eleven便利商店,维修店或派出所进行储氢罐交换。你可能好奇为什么是7-Eleven呢?因为台湾7-Eleven营业据点数量排名全球第五,仅次于美国,日本,泰国和韩国。台湾几乎任何地方都可步行至附近的7-Eleven。
APFCT has continued to build upon this hydride storage fueling model over the last two years. It has tested a number of different vehicles, all of which use identical canisters. Those with larger hydrogen demands simply require more canisters for operation.
亚太燃料电池在过去的两年持续建立低压储氢的商业模式。目前使用相同的储气罐在数个不同类型的车辆上进行测试,如车辆运作需使用大量的电力,只需要增加储氢罐的数量。
Scooters 2.0
燃料电池托摩车
Last November, APFCT began a second scooter demonstration in Taiwan with the city government of Taipei. In this demonstration 20 scooters have been deployed for use in environmental auditing site inspections and surveying by city officials.
去年十一月,亚太燃料电池在台北市政府展开第二次示范运行。在此示范当中,台北市政府使用亚太二十辆摩托车作为公务车,在官员环境审计及现场检查时使用。

APFCT’s current scooter model has a range of approximately 80 km.
亚太最新一代摩托车续航力约80公里

Fueling costs can be very economic – in the Taipei demonstration, the local cost of electricity to generate the hydrogen results in a canisters exchange cost of NTD 30 (about USD 1).
充氢成本可以是经济实惠的 – 在台湾示范运行中储氢罐交换价格为新台币30元 (约一块美金),此价格包括当地产氢所使用的电力及物流费。


APFCT says this current model would sell for about NTD 90,000, about USD 3,000. That’s not quite a commercial price, but getting close. Assuming a successful demonstration, orders from city governments and the public could generate sufficient volume to get the price down, which would make APFCT fuel cell scooter be competitive with gasoline powered scooters.
根据亚太表示,最新燃料电池摩托车售价约新台币九万元,约三千美金。这并非商业化的价格,但已经愈来愈接近了。如未来有一个成功的示范运行,让亚太能从政府和民众取得大量的订单,将有望大规模经济生产并降低价格,并使亚太燃料电池摩托车车与传统燃油驱动摩托车相抗衡。
Fork Lifts
燃料电池叉车
APFCT has migrated its consumer friendly fueling system to a forklift application. They recently completed a demonstration of 5 forklifts in a distribution center in Taiwan operated by the RC Mart chain.
亚太燃料也将便利的充氢系统运用在叉车上,并在近期在台湾连锁量贩店爱买的配送中心完成五辆叉车车队的示范运行。

Forklifts are an area of significant growth for fuel cells and one of the few applications that are commercially economic. Globally, there are at least 5,000 forklifts in operation at large distribution centers. These forklifts were all originally electric drive battery units. Their electric drives were all replaced with a fuel cell power system. The fuel cell systems themselves are somewhat expensive, however when one compares their total cost of ownership of the swapped out system with that of an electric drive, fuel cell systems are cheaper to operate and increase worker productivity.
燃料电池叉车近期有显着的销售成长,也是少数目前具有经济效益的燃料电池应用之一。在全球至少有五千辆叉车在大型配送中心运作。这些叉车原本都是电动叉车,现在被替换成燃料电池动力系统。燃料电池系统本身较电池昂贵,但若以总体拥有成本来衡量,燃料电池系统则相对便宜,并且能提高员工的工作效率。
The following chart provides a quick cost comparison between the two systems. In this case, a Class III forklift is used, which is a smaller unit where the operator rides on the truck.
下面的图表显示电动和燃料电池二个系统之间成本比较。此表当中我们使用较小型的搬运车来进行比较。

Source: APFCT, Worthington Sawtelle LLC, National Renewable Energy Laboratory
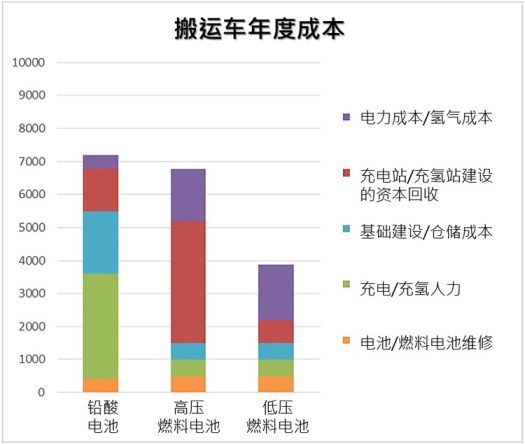
图片来源: APFCT, Worthington Sawtelle LLC, National Renewable Energy Laboratory
The bottom line here is that even though their fueling infrastructure and electricity costs are less, the battery driven units require significant labor for charging and refueling. What the chart does not show is that more battery units are required for a three shift day than fuel cell units; one battery unit must always be charging.
最重要的是,即使电动搬运车所需的基础设施和电力成本较低,但是使用电动搬运车需要大量劳力为其进行充电和加油。虽然此图表并未显示,但实际上若运用于一天三班制的工作环境下,电动搬运车需要大量的备用电池以供替换。
Virtually all fuel cell options for forklifts use high pressure hydrogen storage linked to a fuel cell with high internal pressures. Notice that in the high pressure bar above, all but the cost of hydrogen are likely to be relatively constant. The economics of the system depend almost entirely on the cost of hydrogen fuel. All systems currently in operation get their hydrogen delivered to a dispensing station in the distribution center from tube truck deliveries. The cost of that hydrogen increases with distance from the hydrogen production facility. Because of these high costs, a few operators are considering the installation of small natural gas reformers to generate hydrogen on-site from natural gas, which is relatively inexpensive in today’s market.
绝大部份燃料电池叉车都使用高压储氢罐。值得注意的是在上述高压系统,其中氢的成本很可能无法稳定。该系统的经济性几乎完全依赖氢燃料的成本。所有目前运作中的系统使用的氢气都从卡车运输至其配送中心的充氢站。在这样的情况下,氢气的成本会随着与制氢中心的距离而增加。由于这些高昂的成本,一些运营商正在考虑在厂内设置小型天然气重组器来制造氢气,这是在目前市场上比较经济的制氢方式。
APFCT, characteristically, has developed a much different solution to this application, one which enhances its already winning cost analysis. The APFCT unit is shown as the third bar in the chart above, labeled “Low Pressure Fuel Cell.” This forklift design uses four fuel canisters that are identical to the ones used in the scooter. But unlike most other fuel cell forklifts, the APFCT unit uses a low internal pressure fuel cell. Lower internal pressures are less susceptible to membrane failure and have less moving parts. In the picture below the cabinets by this unit are the refuelers. Fuel canisters are placed in a rack in the unit and refilled with hydrogen being released from water through electrolysis.
亚太燃料电池一如既往地为叉车发展出与众不同的解决方案,图表成本分析中也显示了此解决方案的优势。亚太的叉车系统列在图表中的第三条,标有“低压燃料电池” 。该叉车设计采用四个储氢罐,与燃料电池摩托车所使用的储氢罐是相同的。和大多数燃料电池叉车不同的是,亚太使用了低内压的燃料电池。较低的内部压力使质子交换膜较不易损坏且运动部件较少。在图中位于叉车旁边的柜子内置有充氢机。充氢机可透过电解水制氢将氢气充填至氢气罐。
Next Steps
未来展望
The best technology does not always make it in the marketplace, however. APFCT’s fueling approach offers a number of clear advantages over what is now regarded as conventional. Nonetheless, a number of alternative methods to store and dispense hydrogen in transportation applications have been attempted and then largely abandoned – usually due to the fact that such commercialization decisions are heavily influenced by the automobile manufacturers. It remains to be seen if APFCT can overcome the momentum already gained by others who are thoroughly invested in the high pressure cylinder on-board hydrogen storage model.
有时最好的技术并不容易商业化,亚太的低压储氢方式提供了许多明显的优势。尽管如此,目前已有部份储氢和配氢的替代方法都已经尝试过后并放弃 – 通常是由于此类替代方案的商业化主要是由汽车制造商所决策。让我们拭目以待,看亚太是否能克服多数使用高压储氢罐的主流,让低压金属储氢成为通往氢经济的快捷方式。